Congratulations to All Who Bought @ 1950 /- . ” Patience Will Always Pays “.Touched New 52 Weeks High ON 16.04.2021 : Study Purposes Only .Stock Touched New 52 Weeks High 2401.45 /- . Expecting More from This Stock Get Ready with Your Seat Belts. Here is a Link Given Below.
Disclaimer: I am Not a SEBI REGISTERED ANALYST. This Website & Its Owner, Creator & Contributor is Neither a Research Analyst nor an Investment Advisor and Expressing Option Only as an Investor in Indian Equities. All trading strategies are used at your own risk.
He/ She are Not Responsible for any Loss a Rising out of any Information, Post or Opinion Appearing on this Website.
Investors are advised to do Own Due Diligence or Consult Financial Consultant before acting on Such Information. Author of this Website not providing any Paid Service and not Sending Bulk mails/SMS to Anyone. Information is in no way guaranteed.
No guarantee of any kind is implied or possible where projections of future conditions are attempted. Investment/Trading in securities Market is subject to market risk. This is my personal thoughts on this company and not at all a buy recommendation. Do own due diligence /consult a SEBI registered advisor before any action.
Government Penny Stock Look Into for High Returns – Study Purposes Only .
EPS : 1.71 .
DIVIDEND YIELD : 2.61 %
STOCK P/E : 12.80
BOOK VALUE :33.50 .
FACE VALUE : 10 .
PFS has been promoted by PTC India Ltd (PTC) as a company incorporated under the Companies Act 1956 and registered with RBI as a NBFC.
It is a systemically important non-deposit taking NBFC classified as “Infrastructure Finance Company (IFC)” by RBI and is listed on the Bombay Stock Exchange Limited and the National Stock Exchange of India Limited. PFS, being an IFC, is engaged in the business of making investments in, and providing financing solutions to companies with projects in the power sector and related areas across the entire energy value chain.
The business model and commitment of PFS is to partner in infrastructure development and support the Power Sector by catering to the financial requirements of the sector.
PFS strongly believes in partnering and forging strong relationship with credible stake holders to provide complete financial services for all links in the energy value chain.
PFS is structured as a ‘one-stop shop’ for financing of power projects over the project life cycle. The USP of PFS lies in its ability to undertake risk analysis of power projects and add value by mitigating those while structuring the financial product in an expeditious timeframe following a highly professional approach.
PFS majorly provides fund based / non-fund based financial assistance in the form of debt or structured debt instruments, taking into account the need of the promoter/borrowing company,
condition of the financial markets, risks and rewards from the project and regulatory requirements. PFS provides debt financing on Non-Recourse or on Limited Recourse basis for following:-
Expenditure on a Greenfield project
Expenditure on capacity expansion/renovation of an existing asset
Acquisition of an operating asset
Takeover of an existing debt facility
Securitization of future cash-flows of an operating asset
Investment as equity or structured debt in a subsidiary company for capex addition
Takeout Financing of standard assets1
Pooling of assets
Structuring and Refinancing under 5/25 Scheme of RBI (termed as for Flexible Structuring and Refinancing of Long Term Project Loans to Infrastructure and Core Industries)
Type of Instruments
Fund based
Term Debt or Project Debt
Corporate Debt
Bridge Debt
Bill Discounting
Non-Fund based
Letter of Comfort (LoC) for opening up of LC or issuance of PBG (Performance Bank Guarantee) by banks, where PFS has sanctioned Term Debt
Credit Enhancement Scheme
Deferred Payment Guarantee against supply of Machinery/ Equipment
Other services In line with the vision to become the most preferred financial partner, PFS also provide following services complementing the financial assistance business:
Act as Lead FI
Act as Syndicator
Act as Security Agent
Act as Facility Agent
Underwrite debt
Act as Project Appraiser
Act as DPR Consultant/Preparer
Debt assistance can be considered for a project in the entire energy value chain and projects in specified infrastructure sector.
Eligible Projects in energy value chain: Projects in Power Generation, Transmission and Distribution, Lighting, Energy Meters, Switchgears, Switchboards, Transformers, Cables, Fuel Supply, Fuel transportation, Cogeneration plants in various manufacturing entities, Oil and Gas Sector comprising of Gas fields,
Refining of Crude Oil, Gasification, Re-gasification, Liquefactions plant, Gas Pipelines, Development of Coal mine, Ports, Energy conservation and other sectors related to infrastructure within the entire energy value chain or any other project which may be approved by the Board of Directors.
Eligible projects in specified infrastructure sector: PFS may consider financing of Infrastructure projects other than eligible projects in the energy value chain in the following peripheral areas:-
Roads
Ports – Green field & brownfield ports.
Infra Logistics Services – Development of Container terminal, Road or Railway line connecting port & hinterland, Railway Sidings, Private Railway Fright Terminals (PFTs) etc.
Other areas of infrastructure like city water distribution etc.
PFS: A PREFERRED FINANCIAL PARTNER
PFS is highly valued by project developers and is considered by them as a most preferred financial partner.
PFS firmly believes in developing long term relationship with credible stakeholders apart from mere participation in equity and provision of debt assistance.
PFS aims at a win-win situation for both PFS and the project developer and also works for the overall interest of the project.
PFS addresses specific requirements of risk capital by offering innovative solutions at various phases of project development.
PFS also guides potential promoters in the sound development of power projects.
PFS provides technical inputs in structuring of the project and achieving in financial closure.
PFS develops strong relationships with projects by adding value through fund based and non-fund based support.
PFS believes in adding value to projects while making investments and beyond.
PFS mobilizes its resources on most competitive terms to channelize those in high yielding assets in the energy value chain.
aims are armoured against impacts, strategies are shared for unprecedented results and excellence is earned through constant efforts. Visualising a Brighter tomorrow and striding towards a progressive future,
PFS challenges the existing competitive scenario by reaching out to project and providing financial assistance tailored to their specific need epitomizing efficacy. Every single move of PFS inspires and instigates results that stand apart internationally.
PFS offers debt assistance to projects and structures the debt assistance taking into consideration factors like needs of the borrowing entity, the market conditions, regulatory requirements, risks and rewards from the projects.
PFS offers debt assistance to projects and structures the debt assistance taking into consideration factors like needs of the borrowing entity, the market conditions, regulatory requirements, risks and rewards from the projects.
PFS offers long term loans, short term loans as well as bridge financing to the projects.
PFS provides debt assistance to projects in the entire energy value chain i.e. power generation projects, transmission and distribution projects, fuel sources and related infrastructure.
Promoters/ Developers looking for debt assistance from PFS may contact us for further details or can provide preliminary information for our better understanding of the requirements and for quick response.
PFS advisory team assists companies in structuring and raising debt and mezzanine capital tailored to their needs. Leveraging on its deep-rooted relationships with Banks and Financial Institutions and extensive experience in executing structured and vanilla debt transactions,
PFS handholds companies in structuring and raising capital which is optimal in terms of cost and structure and integrates into the long term as well as short term aspirations of the clients. With a core dedicated team of in-house professionals with sectoral as well cross-functional expertise,
PFS strives to help its clients become more competitive, effective and successful.
As an underwriter, lead arranger, and syndicator, PFS is structurally focused on renewable energy projects, both Greenfield as well as Brownfield expansion projects and specializes in products like vanilla project finance debt, structured debt and securitization
The focus of equity investment is for green-field as well as brown-field projects, backed by promoters with proven track record, good growth prospects and clearly defined exit routes.
The investment horizon tends to focus on the short to medium term. The Company also provides last mile equity to power projects as and when required depending upon the project viability, its progress and investment guidelines.
PFS does not merely provide equity but also adds value to the project through PTC brand and by sharing experience of PFS team in structuring the transaction.
PFS closely associates with the investee project to help them to achieve the project development and financial closure in best possible way.
Promoters/ Developers desirous of equity participation may contact us for further details or can provide preliminary information for our better understanding of the requirements .
Since 2008 PFS has made its significant contribution in the development of Power Sector through its participation in form of equity or debt financing.
Debt Financing As on 30th September 2019, PFS has net sanction of more than Rs 18,000 Crore in form of Long term and short term debt assistance to various Infrastructure projects which will help to generate more than 14000 MW in country. As on 30th September 2019, PFS has outstanding credit of approx Rs 13,211 crore.
Why ?
Uniqueness of PFS lies in developing and delivering structured products linked to equity or debt, tailored to risk profile and needs of specific projects in record timeframe. Thus, PFS not only provides financial assistance but also adds value to the project development process and that too by following a highly systematic and professional approach.
All-inclusive, diversified and efficient value chain established by PFS speaks for itself and adds to the exclusivity espoused by the organization. PFS offers a sustained efficient delivery of financial services to power projects of the marketing and selling arrangement of power, fuel intermediation and offering advisory services under the dependable PTC umbrella.
DEEP UNDERSTANDING OF INDIAN POWER SECTOR
PFS is exclusively devoted to power sector and has thus acquired over the years domain sector expertise. • In addition, PFS has access to PTC’s proficiency in energy value system in carrying out activities like fuel intermediation, power trading and trading with cross border entities.
ONE STOP SERVICE
PFS offer wide range of debt and equity linked financing products meeting the financing needs of power projects at various stages of product life cycle from development stage s financial closure to post operationalisation.
PFS also understands the significance of making available a whole gamut of vital reliable services that include tying up of the marketing and selling arrangement of power, fuel intermediation and offering advisory services under the dependable PTC umbrella.
DIVERSIFIED BUSINESS OPERATIONS
Spreading its wings over diversified sectors, PFS is gradually extending its hold in the value chain from power generation to transmission and distribution assets, fuel source related infrastructure like, ports, and equipment manufacturers in power sector.
PFS is also focussing on its role in renewable space – Solar, Biomass, Wind Energy and Small Hydro.
CUSTOMER FOCUS APPROACH
The rewarding experience held by PFS enables it to structure its products, and service offerings based on the specific requirements of the project and their developers. The services are moulded depending upon the risk and reward profile at competitive transaction costs and with least response time.
Cmp : 16.65 , Target : 19.80 – 22.60 ++.
Stoploss : 12.30 . On Weekly Closing Basis.
Time frame : 2 Months to 1 Year .
EPS : 1.71 .
DIVIDEND YIELD : 2.61 %
STOCK P/E : 12.80
BOOK VALUE :33.50 .
FACE VALUE : 10 .
Disclaimer: I am Not a SEBI REGISTERED ANALYST. This Website & Its Owner, Creator & Contributor is Neither a Research Analyst nor an Investment Advisor and Expressing Option Only as an Investor in Indian Equities. All trading strategies are used at your own risk. He/ She are Not Responsible for any Loss a Rising out of any Information, Post or Opinion Appearing on this Website.
Investors are advised to do Own Due Diligence or Consult Financial Consultant before acting on Such Information. Author of this Website not providing any Paid Service and not Sending Bulk mails/SMS to Anyone. Information is in no way guaranteed.
No guarantee of any kind is implied or possible where projections of future conditions are attempted. Investment/Trading in securities Market is subject to market risk. This is my personal thoughts on this company and not at all a buy recommendation. Do own due diligence /consult a SEBI registered advisor before any action.
Expecting New 52 Weeks High in coming Months Time Frame Also . No need to Pay all are for Study Purposes Only .
Disclaimer: I am Not a SEBI REGISTERED ANALYST. This Website & Its Owner, Creator & Contributor is Neither a Research Analyst nor an Investment Advisor and Expressing Option Only as an Investor in Indian Equities. All trading strategies are used at your own risk. He/ She are Not Responsible for any Loss a Rising out of any Information, Post or Opinion Appearing on this Website. Investors are advised to do Own Due Diligence or Consult Financial Consultant before acting on Such Information. Author of this Website not providing any Paid Service and not Sending Bulk mails/SMS to Anyone. Information is in no way guaranteed. No guarantee of any kind is implied or possible where projections of future conditions are attempted. Investment/Trading in securities Market is subject to market risk. This is my personal thoughts on this company and not at all a buy recommendation. Do own due diligence /consult a SEBI registered advisor before any action.
Due to Corona Situation One Need to Look into in such a Company .
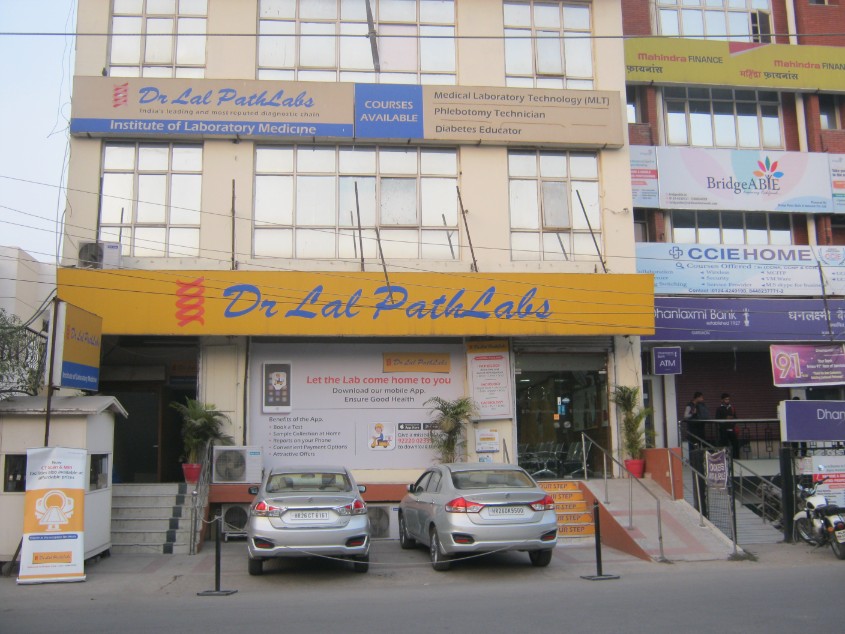
This is Finest Diagnostic Center & Pathology Over all Best in India .
A Glance at the Roots
Late Dr. Major S.K. Lal, commenced the business of providing pathology services and maintaining a blood bank in the year 1949 through sole proprietorship M/s Central Clinical Laboratory and M/s Blood Bank Transfusion Centre. The business of diagnostic and related healthcare tests and services now continues to be provided by our Company.
An established brand associated with Quality Services
We focus on providing patients quality diagnostic healthcare services in India. Through our network, we offer patients convenient locations for their diagnostic healthcare services and efficient service. With over 3,368 diagnostic and related healthcare tests and services offered, we believe we are capable of performing substantially all of the diagnostic healthcare tests and services currently prescribed by physicians in India.
Our key competitive strengths are:
Business model focused on the patient as a customer and an established consumer healthcare brand associated with quality services, in a market where patients generally choose their diagnostic healthcare service provider.
Well-positioned to leverage upon one of the fastest-growing segments of the Indian healthcare industry.
A network whose growth yields greater economies of scale, combined with a “hub and spoke” model that is scalable for further growth.
Centralized information technology platform that fully integrates our network and is scalable.
Attractive financial performance, financial profile and return on invested capital.
Experienced leadership team with strong industry expertise and successful track record.
Many of our clinical laboratories participate in numerous externally administered quality surveillance programs, including the National Accreditation Board for Testing and Calibration Laboratories prescribed program. As of June 30, 2015, 27 of our laboratories were accredited by the NABL in accordance with ISO 15189.
Some of our laboratories have achieved International Organization for Standardization, or ISO, certification for their quality systems. Our National Reference Laboratory has obtained ISO 9001:2008 certification (for the performance of routine and advanced diagnostic pathology testing services, including clinical trials), ISO 15189:2007 (for quality management in medical laboratories), ISO 15189:2012 certification (in the field of medical testing) and ISO 27001:2013 certification (for establishing an effective information management system that maintains and processes information security at our data center).
One of India’s Top Diagnostic Chains.
We have built a national network consisting of our National Reference Laboratory in New Delhi along with 190+ other clinical laboratories, 1700+ patient service centers and 5,000+ pickup points as of March 31, 2017 with the widest test menu of 4500 tests and panels. Our network has coverage across India, including metropolitan areas such as New Delhi, Mumbai, Bengaluru, Chennai, Hyderabad and Kolkata. We offer access to diagnostic healthcare services in India through our nationwide network of clinical laboratories (including our National Reference Laboratory), patient service centers and pickup points.
Technical Departments :
Routine Biochemistry & Immunoassays
Special Biochemistry
Serology
Hematology
Special Immunology
Transplantation Immunology
Coagulation
HPLC & Electrophoresis
Histopathology & Cytopathology
As one of the top pathology labs in India, Dr Lal PathLabs has a very strong focus on hiring and retaining top quality manpower to drive our different departments within and outside the labs. Despite our size, we maintain an environment that nurtures some of the top thinkers in India in their respective fields of expertise.
Over 3000 individuals work at the Dr Lal PathLabs in India with over 55 percent of the staff in laboratory functions. We have a qualified team of 147 pathology specialists, 8 Radiologists, 13 Microbiologists, 5 Biochemists and 11 specialists with doctorate degrees. Also, there is a growing pool of young leadership from top institutions like AFMC, IIMs, IITs, XLRI, SP JAIN amongst others.”
AN ESTABLISHED BRAND ASSOCIATED WITH QUALITY SERVICES
We focus on providing patients quality diagnostic healthcare services in India. Through our network, we offer patients convenient locations for their diagnostic laboratory services and efficient service. With over 3,368 diagnostic tests and related healthcare tests and services offered, we believe we are capable of performing substantially all of the diagnostic healthcare tests and services currently prescribed by physicians in India. By delivering most accurate reports over the years, Dr. Lal PathLabs has earned the reputation of being amongst the most trustworthy and reliable pathology labs in India.
ONE OF INDIA’S TOP DIAGNOSTIC CHAINS
We have built a national network consisting of our National Reference Laboratory in New Delhi along with 190+ other clinical / medical laboratories, 1700+ lab patient service centers and 5,000+ pickup points as of March 31, 2017 with the widest test menu of 4500 tests and panels. Our network has coverage across India, including metropolitan areas such as New Delhi, Mumbai, Bengaluru, Chennai, Hyderabad and Kolkata. We offer access to one of the best diagnostic pathology services in India through our nationwide network of clinical / medical laboratories (including our National Reference Laboratory), and pickup points.
LABORATORY ACCREDITATIONS
Dr. Lal PathLabs, Rohini is NABL certified pathology lab in India. It is also among the few Indian laboratories which accredited by CAP (College of American Pathologists) and Certified by ISO 9001 (International Organization of Standardization).
International Business :
Dr Lal PathLabs is present in various parts of the world and prides itself on providing high quality services combined with 100% accurate reports, patient centric service outlook, state-of-the-art technology and an extensive network of skillful physicians through setup of labs, either fully owned or in partnership with a local partner. Dr Lal PathLabs operates labs and diagnostic centres in Saudi Arabia, UAE, Nigeria, Bangladesh and Sri Lanka to name a few.
All international tie-ups have followed successful completion of both intensive and extensive trial runs wherein samples were tested parallel to each other at the client’s lab and at a Dr Lal PathLabs post which the results were compared. As of today, the International Division operates in a wide range of geographies – The Gulf and the Middle East, Africa and South East Asia. Some of the reasons why you should work with us are:
Quality: Highly accredited, CAP & NABL, ISO 27001:20012, CLIA
THIS COMPANY CAN BE LONG TERM COMPANY . SHORT TERM CAN BE VERY GOOD TOO .
BEST BUY AT 2400 -2800.
TARGETS : 3500 – 4800 – 6000++
BASED ON : FUNDEENTALS OF THE COMPANY .
ALL ARE FOR STUDY PURPOSES ONLY .
Disclaimer: I am Not a SEBI REGISTERED ANALYST. This Website & Its Owner, Creator & Contributor is Neither a Research Analyst nor an Investment Advisor and Expressing Option Only as an Investor in Indian Equities. All trading strategies are used at your own risk.
He/ She are Not Responsible for any Loss a Rising out of any Information, Post or Opinion Appearing on this Website. Investors are advised to do Own Due Diligence or Consult Financial Consultant before acting on Such Information. Author of this Website not providing any Paid Service and not Sending Bulk mails/SMS to Anyone. Information is in no way guaranteed. No guarantee of any kind is implied or possible where projections of future conditions are attempted. Investment/Trading in securities Market is subject to market risk.
When ever Stock Markets Correction Starts We need to buy Large Cap Stocks Instead of Small Caps & Mid caps Because When Ever Markets Recovers These are the Stocks which will Gain Early .
Bajaj Finance Ltd., incorporated in the year 1987, is a Large Cap company (having a market cap of Rs 277,672.25 Crore) operating in NBFC sector. Bajaj Finance Ltd.
key Products/Revenue Segments include Interest, Fees & Commission Income, Income From Sale Of Share & Securities, Income From Financial Services and Service Charges for the year ending 31-Mar-2020.
For the quarter ended 31-12-2020, the company has reported a Consolidated Total Income of Rs 6,658.47 Crore, up 2.07 % from last quarter Total Income of Rs 6,523.29 Crore and down 5.23 % from last year same quarter.
Total Income of Rs 7,025.93 Crore. Company has reported net profit after tax of Rs 1,145.98 Crore in latest quarter.
The company’s top management includes Mr.Rahul Bajaj, Dr.Naushad Forbes, Ms.Gita Piramal, Mr.Ranjan Sanghi, Mr.Dipak Poddar, Dr.Omkar Goswami, Mr.D J Balaji Rao, Mr.Rajiv Bajaj, Mr.Madhur Bajaj, Mr.Rajeev Jain, Mr.Sanjiv Bajaj, Mr.Anami Roy. Company has S R B C & Co. LLP as its auditors.
Bajaj Finance is mainly engaged in the business of lending. BFL has a diversified lending portfolio across retail, SME and commercial customers with a significant presence in urban and rural India.
It also accepts public and corporate deposits and offers variety of financial services products to its customers.
Largest NBFC in India Bajaj Finance (BFL) started its journey in the year 1987 as a vehicle financing company and now is one of the largest NBFC in India.
It has more than 1,47,100 Cr of Assets under Management (AUM) . BFL has a diversified lending portfolio and has its presence in various lending segments.
Consumer Lending (36% of AUM) BFL finances more than 13.5 Million customers and is one of the leading lenders of consumer electronics, furniture and digital products.
The company provides its own Unique Customer Identification Number (EMI) to its customers after their first purchase and the company has issued 22 Million Cards through which it has financed 13.6 Million Purchases.
Financing customers through EMI cards for their purchase on online portals have been one of the important business of the company in last few years and it showed a 22% growth in the previous year.
Mortgages (33% of AUM) The segment offers Home loans, loans against properties, developer finance and lease rental discounting and many more.
The company has the right for the possession of the vehicles or the properties in case of default by the customer and the company sells those assets on auction basis.
SME Lending (13% of AUM) Under this segment, the company offers secured and unsecured loans to small businesses.
The business is present in over 1,100 locations in India and they provide working capital loans and term facilities and the business grew by 15% Year On Year basis.
Rural Lending (9% of AUM) BFL started this initiative in the year 2013 and now is operational in 1,357 locations through nearly 19,600 points of presence in its rural lending division present across 21 states and the segment has witnessed a higher growth.
The segment had an AUM of 13,328 crore an increase of 44% YoY compared to the previous year.#
Commercial Lending (9% of AUM) Under this segment the company provides loan against securities, loans to financial institution group (FIG), working and growth capital loans to various Industries and Midsized companies and the company also fully exited from the warehouse receipt financing business.
Housing and Depositary Business BFL also has its presence in the Housing Finance segment through its 100% subsidiary Bajaj Housing Finance which has a AUM of 35,492 crores & the company operates in the Depositary business through Bajaj Finance securities Ltd and it acts as a stock broker and depository participant.
Largest Financier for Bajaj Auto The company financed a purchase of over 1.1 million motorcycles and about 187,000 three-wheelers in FY20 for Bajaj Auto Ltd.
This constituted over 54% of domestic sales of Bajaj motorcycles and 51% of domestic sales of Bajaj three-wheelers. The support from Bajaj Auto has enabled the company to get significant customers on day to day basis.
Pan India Presence BFL has a total of 2814 branches spread across India out of which 1604 branches are based on Rural Areas and the rest from the Urban areas.
The company has a overall distribution network of 1,02,800 active networks spread across India
Least Cost of Funds Bajaj Finance has one of the lowest cost of borrowing in the Industry at 8% on Average and the Borrowing mix of the company is Money Markets 42%, Banks 35%, Deposits 19%, ECB 4%. Cheaper Funds has enabled the company to attract the best of the Borrowers.
Deposits The company accepts deposits from both the retail and the corporate clients and the deposits contributed 21% of the borrowings of the company.
There has been a huge increase (92% YOY) in the deposits made by the retail segment.
Lowest NPA among the NBFC’s Bajaj Finance has one of the lowest NPA’s among the NBFC Industry and the company reported a Net NPA of 0.65% for FY20 .
The company has made healthy provisioning of 58% for the stage – 3 Assets and 18% for the Stage 2 Assets through which they have absorbed the Covid stimulated Non repayments .
The low NPA’s can be attributed majorly towards data analytics through Machine Learning (ML).
The company has deployed various ML models which has yielded positive outcomes for the company by predicting the credibility of the borrower.
BFL has also invested in an internal learning facility called the School of Analytics to understand and enhance the usage of ML.
Vulnerable to economic cycles 56% of the loan book of the company constituted of personal loans, consumer durable loans, 2 and 3wheeler finance and other unsecured business loans which are highly risky asset segment and they are vulnerable to the changes in the economic cycles.
Increase in Cash from Investing
Company has used Rs 8756.88 cr for investing activities which is an YoY increase of 62.8%.
Employee & Interest Expense
Company has spent 35.92% of its operating revenues towards interest expenses and 9.67% towards employee cost in the year ending.
Lower credit growth
In line with slowdown in economic growth in FY2020, bank credit recorded a dismal 6.1% year-on-year growth as of
27 March 2020 — largely driven by growth in personal loans. Credit growth to industry and services has been decelerating sharply
Stock Returns vs Nifty 50 Stock gave a 3 year return of 135.64% as compared to Nifty 100 which gave a return of 38.16%.
Stock Returns vs Nifty Financial Services Stock generated 135.64% return as compared to Nifty Financial Services which gave investors 46.01% return over 3 year time period.
Stock generated 135.64% return as compared to Nifty Financial Services which gave investors 46.01% return over 3 year time period.
Disclaimer: I am Not a SEBI REGISTERED ANALYST. This Website & Its Owner, Creator & Contributor is Neither a Research Analyst nor an Investment Advisor and Expressing Option Only as an Investor in Indian Equities. All trading strategies are used at your own risk.
He/ She are Not Responsible for any Loss a Rising out of any Information, Post or Opinion Appearing on this Website. Investors are advised to do Own Due Diligence or Consult Financial Consultant before acting on Such Information. Author of this Website not providing any Paid Service and not Sending Bulk mails/SMS to Anyone. Information is in no way guaranteed. No guarantee of any kind is implied or possible where projections of future conditions are attempted. Investment/Trading in securities Market is subject to market risk.
Here is one More Penny Stock Listed in Both BSE & NSE In advertising. Debt free Company .
Consistent Dividend Paying Company .High Risk & High Profit Company . Healthy Dividend Payout Company .
STUDY PURPOSES ONLY .
We deliver superior quality, highly effective advertising, across all media – print, electronic, outdoor, web and new media. We are experienced at overcoming marketing challenges. We start with insights and use creative thinking to produce advertising that promotes our clients’ brands.
We consider every angle before making recommendations, while keeping an eye on the budget. Effective ideas needn’t cost a fortune, as we have demonstrated time and again.
We have a particularly strong position and rank among the most experienced agencies in financial advertising, with an outstanding track record and a truly remarkable portfolio .
We provide the experience and strategic depth of a large multinational agency with the efficiencies, entrepreneurial drive and cost effectiveness of a small agency.
Services
Corporate Advertising
Brand Advertising
Financial Advertising
Social Advertising
Government Advertising
Media Planning
Media Buying
PRESSMAN ADVERTISING LIMITED
Best Buy Can be : 17.50 – 20.40
52 WEEKS HIGH/LOW : 29.50/14.40 .
TARGET : 25.50 – 30.60 – 60++.
Time Frame : 6 Months To 3 Years .
Study Purposes Only .
Based on Fundemental analysis .
Ratios
Figures in Rs. Crores
ROCE %
Mar 2009
Mar 2010
Mar 2011
Mar 2012
Mar 2013
Mar 2014
Mar 2015
Mar 2016
Mar 2017
Mar 2018
Mar 2019
Mar 2020
ROCE %
6.89%
0.00%
-2.96%
-3.52%
55.88%
19.92%
21.40%
23.70%
33.36%
25.24%
22.79%
17.28%
Debtor Days
0.00
0.00
0.00
93.79
68.54
84.05
56.11
60.23
80.92
84.06
86.31
Disclaimer: I am Not a SEBI REGISTERED ANALYST. This Website & Its Owner, Creator & Contributor is Neither a Research Analyst nor an Investment Advisor and Expressing Option Only as an Investor in Indian Equities. All trading strategies are used at your own risk.
He/ She are Not Responsible for any Loss a Rising out of any Information, Post or Opinion Appearing on this Website. Investors are advised to do Own Due Diligence or Consult Financial Consultant before acting on Such Information.
Author of this Website not providing any Paid Service and not Sending Bulk mails/SMS to Anyone. Information is in no way guaranteed. No guarantee of any kind is implied or possible where projections of future conditions are attempted. Investment/Trading in securities Market is subject to market risk. This is my personal thoughts on this company and not at all a buy recommendation. Do own due diligence /consult a SEBI registered advisor before any action.
Stock Touched new 52 Weeks High on 09.04.2021 @ 72.75/-. Study Purposes Only . Congratulations Stock Doubled in Just 8 Months Time Frame . Here are Full Details with Link.
All Construction Based Companies are Increasing their Prices and Expecting this stock can 50 % to 80% From these Levels also in Coming Months & Years Also .
Disclaimer: I am Not a SEBI REGISTERED ANALYST. This Website & Its Owner, Creator & Contributor is Neither a Research Analyst nor an Investment Advisor and Expressing Option Only as an Investor in Indian Equities. All trading strategies are used at your own risk.
He/ She are Not Responsible for any Loss a Rising out of any Information, Post or Opinion Appearing on this Website. Investors are advised to do Own Due Diligence or Consult Financial Consultant before acting on Such Information.
Author of this Website not providing any Paid Service and not Sending Bulk mails/SMS to Anyone. Information is in no way guaranteed. No guarantee of any kind is implied or possible where projections of future conditions are attempted. Investment/Trading in securities Market is subject to market risk. This is my personal thoughts on this company and not at all a buy recommendation. Do own due diligence /consult a SEBI registered advisor before any action.
Our core strength lies in our ability to diversify. Our vigour does not just lie in past achievements, but it is something we carry forward even today to achieve global leadership.
Our wide range of products and solutions are sold worldwide. These are used in varied applications and segments: from tyres to air conditioners, mines to cricket grounds, automotive to household appliances, food packaging to raw materials for pharmaceuticals. With our diverse portfolio,
we strive to provide the highest quality of sustainable, industrial and specialty intermediates that contribute to a better way of life.
Our maxim – “We always find a better way” – is encapsulated not only in the products that we manufacture and the superior processes that we adopt, but also amply demonstrated in our penchant for innovation, technology leadership, employee engagement, professional management, transparent governance and inclusive growth.
There are always fresh ideas to be explored. No matter how good things are, there is scope to make it even better. Pursuing our passion for continuous improvement, we will seize each moment as an opportunity to create greater value.
Since SRF’s incorporation in 1970 and the subsequent establishment of our first plant in Manali, near Chennai, India in 1974, we have grown from being a single unit tyre cord manufacturer into a leading, professionally–managed, diversified chemicals conglomerate.
Source : https://www.srf.com/
The SRF Promise: Anything you touch has some element of SRF to it
Automotive
Chemicals
Agrochemicals
Technical Textiles
Pharmaceuticals
Food & Agro
Mining
Advertising
Air-conditioning
Renewable Energy
FMCG
Events & Exhibitions
Manufacturing
Lifestyle & Décor
Refrigeration
Electronics
Disclaimer: I am Not a SEBI REGISTERED ANALYST. This Website & Its Owner, Creator & Contributor is Neither a Research Analyst nor an Investment Advisor and Expressing Option Only as an Investor in Indian Equities. All trading strategies are used at your own risk.
He/ She are Not Responsible for any Loss a Rising out of any Information, Post or Opinion Appearing on this Website. Investors are advised to do Own Due Diligence or Consult Financial Consultant before acting on Such Information.
Author of this Website not providing any Paid Service and not Sending Bulk mails/SMS to Anyone. Information is in no way guaranteed. No guarantee of any kind is implied or possible where projections of future conditions are attempted. Investment/Trading in securities Market is subject to market risk.
This is my personal thoughts on this company and not at all a buy recommendation. Do own due diligence /consult a SEBI registered advisor before any action.
Disclaimer: I am Not a SEBI REGISTERED ANALYST. This Website & Its Owner, Creator & Contributor is Neither a Research Analyst nor an Investment Advisor and Expressing Option Only as an Investor in Indian Equities. All trading strategies are used at your own risk.
He/ She are Not Responsible for any Loss a Rising out of any Information, Post or Opinion Appearing on this Website. Investors are advised to do Own Due Diligence or Consult Financial Consultant before acting on Such Information.
Author of this Website not providing any Paid Service and not Sending Bulk mails/SMS to Anyone. Information is in no way guaranteed. No guarantee of any kind is implied or possible where projections of future conditions are attempted. Investment/Trading in securities Market is subject to market risk. This is my personal thoughts on this company and not at all a buy recommendation. Do own due diligence /consult a SEBI registered advisor before any action.
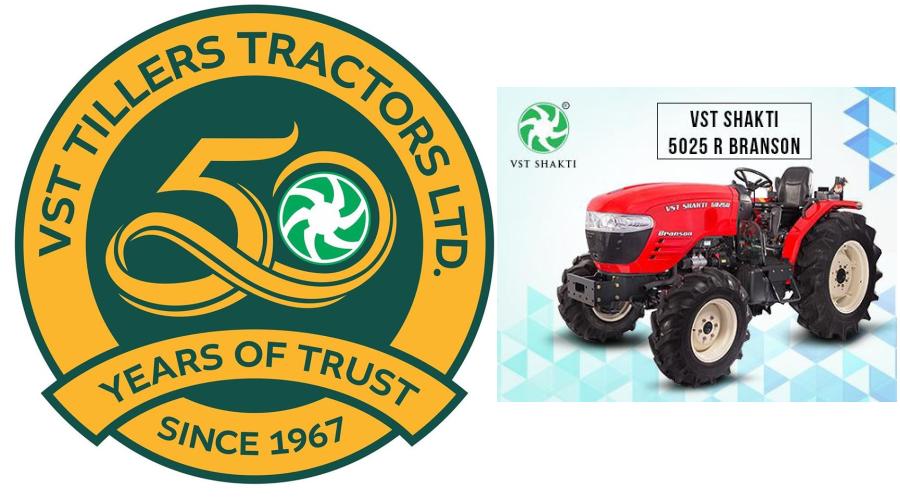
Small Cap Company In Commercial Vehicles Can Give New 52 Weeks High in Coming days .
VST started in the year 1911
VST Tillers Tractors Ltd. is part of VST Group that was founded by Late Sri. V. S. Thiruvengadaswamy Mudaliar in the year 1911.
VST Tillers Tractors Ltd. was established in the year 1967 by the VST Group of companies, a well-known century old business house in South India.
Tractor Manufacturing Unit at Hosur
Tiller Manufacturing Unit at Malur
Component Manufacturing Unit at Mysore
Administrative Block at Hosur
Production line at Malur
VST Tillers Tractors Ltd. was established in the year 1967 by the VST Group of companies, a well known century old business house in South India.
The founder of the group was Sri.V.S.Thiruvengadaswamy Mudaliar who started with humble beginnings under the VST & Sons banner in the year 1911. The group built its reputation through retailing of petroleum products and distribution of Automobiles in Karnataka and Tamil Nadu.
VST Tillers Tractors Ltd. was promoted by VST Motors as a joint venture with Mitsubishi Heavy Industries Ltd, Japan. The company is now the largest manufacturer of Power Tillers in India.
Today, the VST family holds 51% of the equity in the listed company that has recorded consistent growth and has given excellent returns to its shareholders.
VST SHAKTI is India’s No 1 brand in Power Tiller (walking Tractor) in India introduced over five decades ago. A pioneer in compact four – wheel drive tractors initially introduced as “VST Mitsubishi”, has now expanded its presence under the brand “VST SHAKTI” with range of compact and agricultural Tractors.
Tractors are also being marketed under “FIELDTRAC” brand in various markets of European Union meeting the latest EU standards. It has state of the art plant at Malur and Hosur near Bangalore in India & at Mysore for precision components. The products are backed with contemporary testing and R&D facility meeting stringent Global standards.
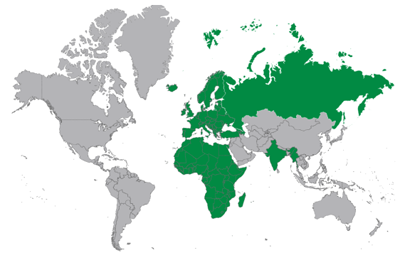
With eye on global opportunity, the company has expanded its presence in more than 20 countries over a decade and established itself as a most preferred brand for the compact tractors
Ratios
Figures in Rs. Crores
ROCE %
Mar 2009
Mar 2010
Mar 2011
Mar 2012
Mar 2013
Mar 2014
Mar 2015
Mar 2016
Mar 2017
Mar 2018
Mar 2019
Mar 2020
ROCE %
51%
53%
48%
39%
31%
45%
30%
29%
24%
26%
14%
6%
Debtor Days
48
71
53
85
74
60
62
70
71
89
57
65
Inventory Turnover
4.39
4.76
5.83
6.32
4.46
4.89
3.86
4.71
5.95
6.68
4.08
3.32
Cmp : 1854 (09.04.2021)
52 WEEKS HIGH/LOW : 2044.90/664.05 (09.04.2021)
Target : 1980 – 2060 – 2260 .
Time Frame : 2 Months To 4 Months .
Based on Fundementals.
STUDY PURPOSES ONLY .
Disclaimer: I am Not a SEBI REGISTERED ANALYST. This Website & Its Owner, Creator & Contributor is Neither a Research Analyst nor an Investment Advisor and Expressing Option Only as an Investor in Indian Equities. All trading strategies are used at your own risk.
He/ She are Not Responsible for any Loss a Rising out of any Information, Post or Opinion Appearing on this Website. Investors are advised to do Own Due Diligence or Consult Financial Consultant before acting on Such Information. Author of this Website not providing any Paid Service and not Sending Bulk mails/SMS to Anyone. Information is in no way guaranteed. No guarantee of any kind is implied or possible where projections of future conditions are attempted. Investment/Trading in securities Market is subject to market risk.
We use cookies to ensure that we give you the best experience on our website. If you continue to use this site we will assume that you are happy with it.OkPrivacy policy